
Capital Market Assumptions
Fiscal worries and a rising term premium are impacting how we assess risk-adjusted returns in core, sovereign bond markets. Long term US Treasuries, for example, are no longer regarded by asset allocators as the world's only safety asset class. Meanwhile, high quality credit spreads are very tight, and at multi-decade lows. For investors, corporate bonds are increasingly seen as a bond substitute.
This is a profound change. Safe haven status was never unconditional. It was always state-contingent; a function of the economic regime and price. But the vivid reality for investors today is that old assumptions are being questioned and maybe inverted. This change requires us to adopt a more nuanced, flexible, and complex definition of portfolio resilience.
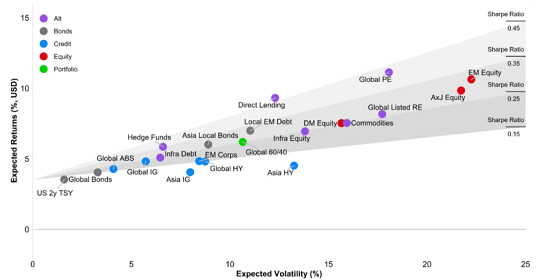
Figure 1 - HSBC AM capital market line
(10 year expected returns for selected assets)
Click the image to enlarge
Source: HSBC Asset Management, as of September 2025
Third, further out on the capital market line, we can spot areas of the market where prospective returns are still high, or where asset market valuations appear "anomalous". Emerging market assets stand out. EM future returns are lifted by positive risk premia and lowly-valued currencies. This year, high expected returns have been realised for investors due to a weaker US dollar. Our analysis indicates investors can expect a continued, multi-year dollar decline. Moreover, some areas of private markets — especially private credits — also appear very attractive for long horizon investors. Particularly so for insurance investors, given the favourable capital treatment.
Our paper explains all these important ideas in more detail, as well as sharing some of the technical references that have inspired our thinking. Section 2 looks at the case for US economic exceptionalism ending, and its asset market implications. We find the strongest evidence for this in the US dollar. Section 3 investigates where investors might find new sources of safety. We argue that there are new options in non-US fixed income, in liquid alternatives or quantitative investment strategies, and in private markets. Section 4 explores the opportunities in emerging market bonds and stocks. It also draws on our detailed long run FX models and research. And Section 5 presents further details of our expected return models, and a technical appendix of our data.
Thank you for your interest in our long run capital market research. I would like to give a special thanks to my colleagues for their contribution to this report, particularly Dominic Bryant, Maulshree Soraliya, Rabia Bhopal, Hussain Mehdi, Miguel Ancona and Jonathan Tetley.
Is US exceptionalism over for investors?
Challenges to US Treasuries' role as a safety asset
What is US exceptionalism? In the context of markets and the economy, here we focus on the preeminent role of US Treasuries (USTs) and the USD as "safety assets", and the stellar returns to US equities over the past 15 years.
The US's long-held position as the world's largest economy, combined with an open capital account, strong institutions, and high levels of policy credibility and soft power, mean the USD has operated as the world's main reserve currency and USTs have been the "go-to" safety asset since the middle of the 20th century.
US Treasuries' role as the "go-to" safety asset since the middle of the 20th century is now subject to challenge from rising government debt levels and more unpredictable policy
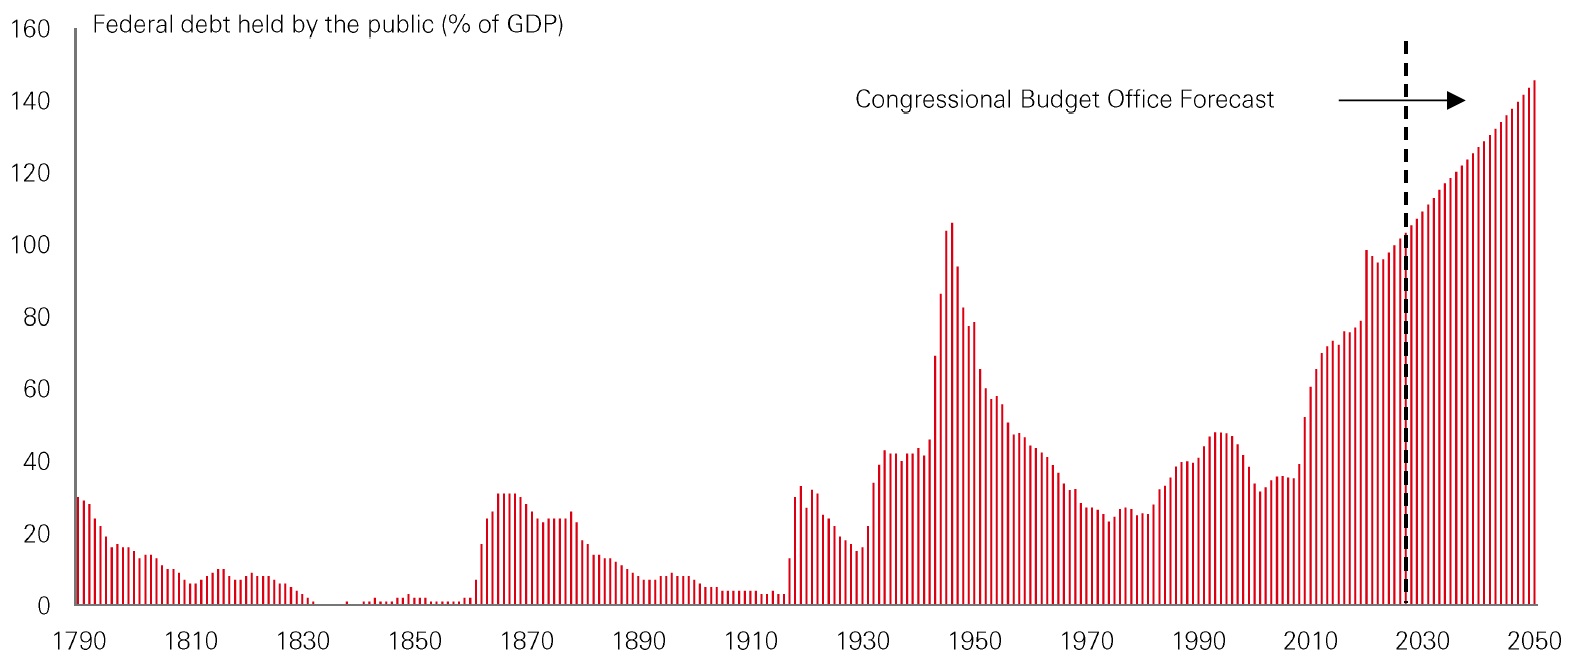
Figure 2 — US federal government debt-to-GDP
Click the image to enlarge
Source: HSBC Asset Management, Macrobond, Congressional Budget Office, September 2025
However, the forecast rise in federal government debt from already high levels (Figure 2), alongside more unpredictable US fiscal and trade policy, and a more antagonistic attitude towards international organizations have raised questions about USTs' role as a safety asset. The undesirable dynamics of federal government debt reflect a long-term rising trend in entitlement spending, which in large part is driven by an ageing population and is, therefore, set to persist. Rising government interest payments are now also exacerbating the problem.
The value of investments and any income from them can go down as well as up and investors may not get back the amount originally invested. Past performance does not predict future return. Any forecast, projection or target contained in this presentation is for information purposes only and is not guaranteed in any way. HSBC Asset Management accepts no liability for any failure to meet such forecasts, projections or targets. The views expressed above were held at the time of preparation and are subject to change without notice. This information should not be construed as a recommendation to invest in the specific country, product, strategy or sector.
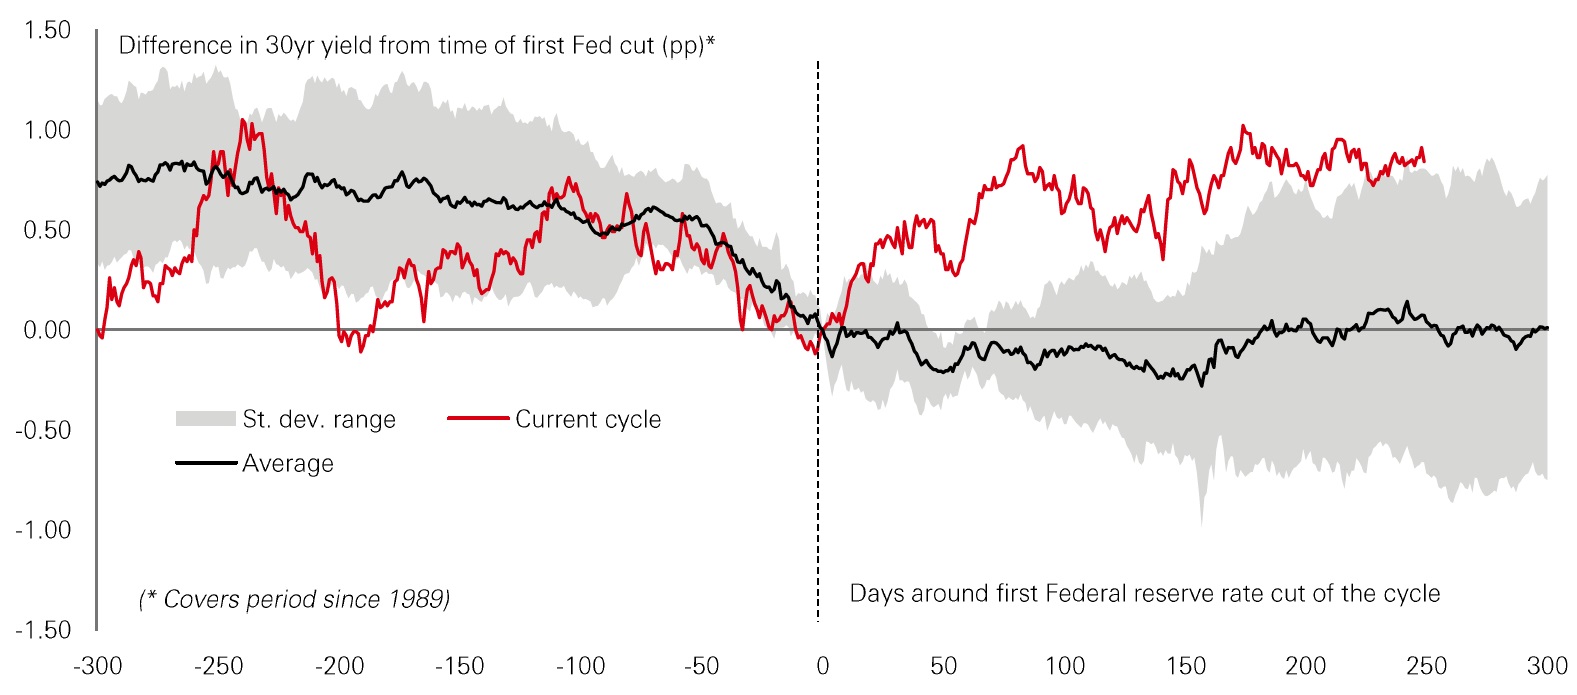
Figure 3 - Unusual 30 year yield response to Fed rate cuts
Click the image to enlarge
Source: HSBC Asset Management, Macrobond, September 2025
Solutions to the burgeoning debt problem - curtailing entitlement spending or increasing the tax take, which is low by international comparison — are politically difficult. The US is seemingly, therefore, in a world of "deficits forever". This does not necessarily imply a crisis is close at hand but, cyclical variation aside, long-dated UST yields are likely to trend higher in the coming years. Indeed, we are already seeing this with 30-year yields, which are drifting up despite the Fed cutting rates and further easing expected. This is at odds with the usual pattern in recent decades (Figure 3).
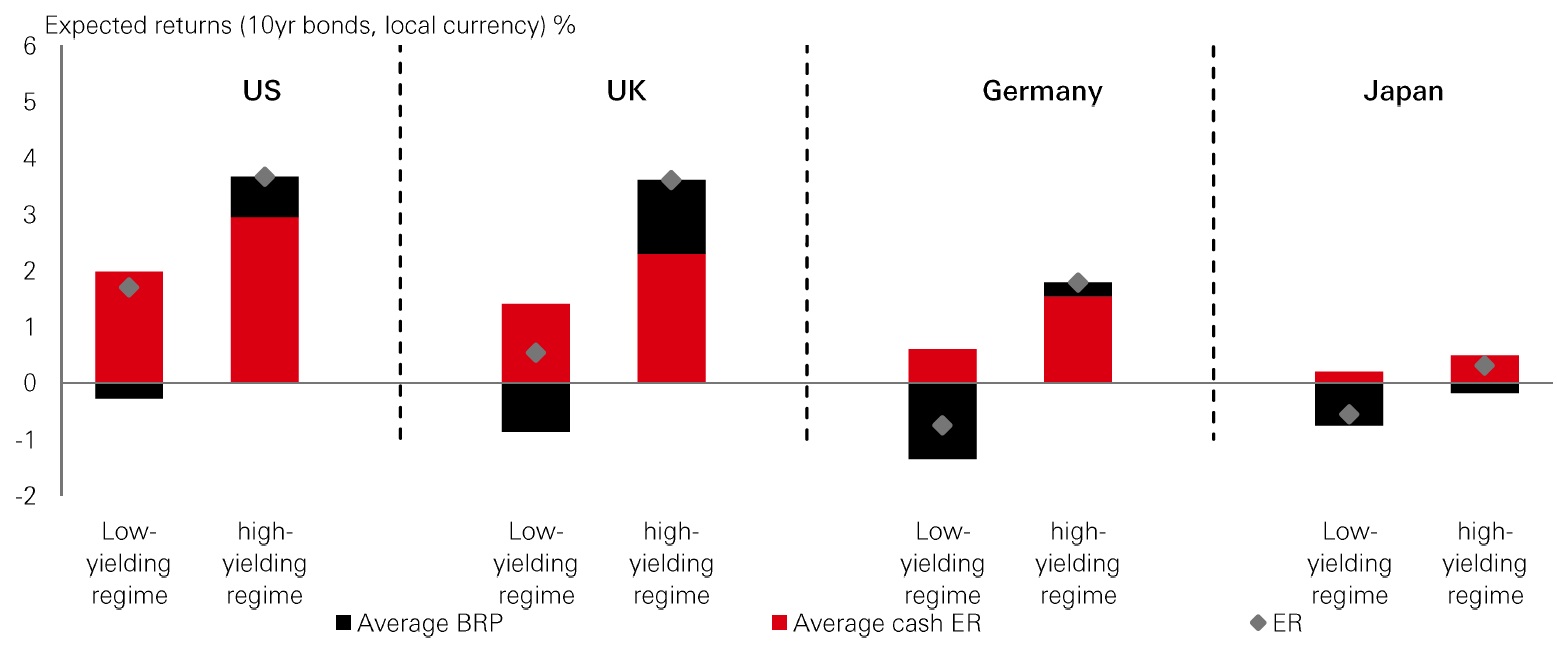
Our expected returns framework accounts for the reversion to a higher interest rate environment, both via a higher neutral cash rate and a higher bond risk premium than existed in the low-yielding post-global financial crisis (GFC), pre-pandemic era (Figure 4).
"Deficits forever" do not imply a crisis is close at hand, but we appear to be reverting to a higher interest rate environment, reflecting both a higher neutral cash rate and a higher bond risk premium
Figure 4 - Cash rate and bond risk premia assumptions
Click the image to enlarge
Source: HSBC Asset Management, Macrobond, September 2025
Is the USD "smile" becoming a "smirk"?
Concerns about the US debt burden and unorthodox policy making have resulted in some unusual short-term behaviour in the UST market. As equity markets corrected lower and recession risk spiked following Liberation Day on 2 April, UST yields rose - the opposite of what would normally be expected and at odds with USTs' role as a safety asset.
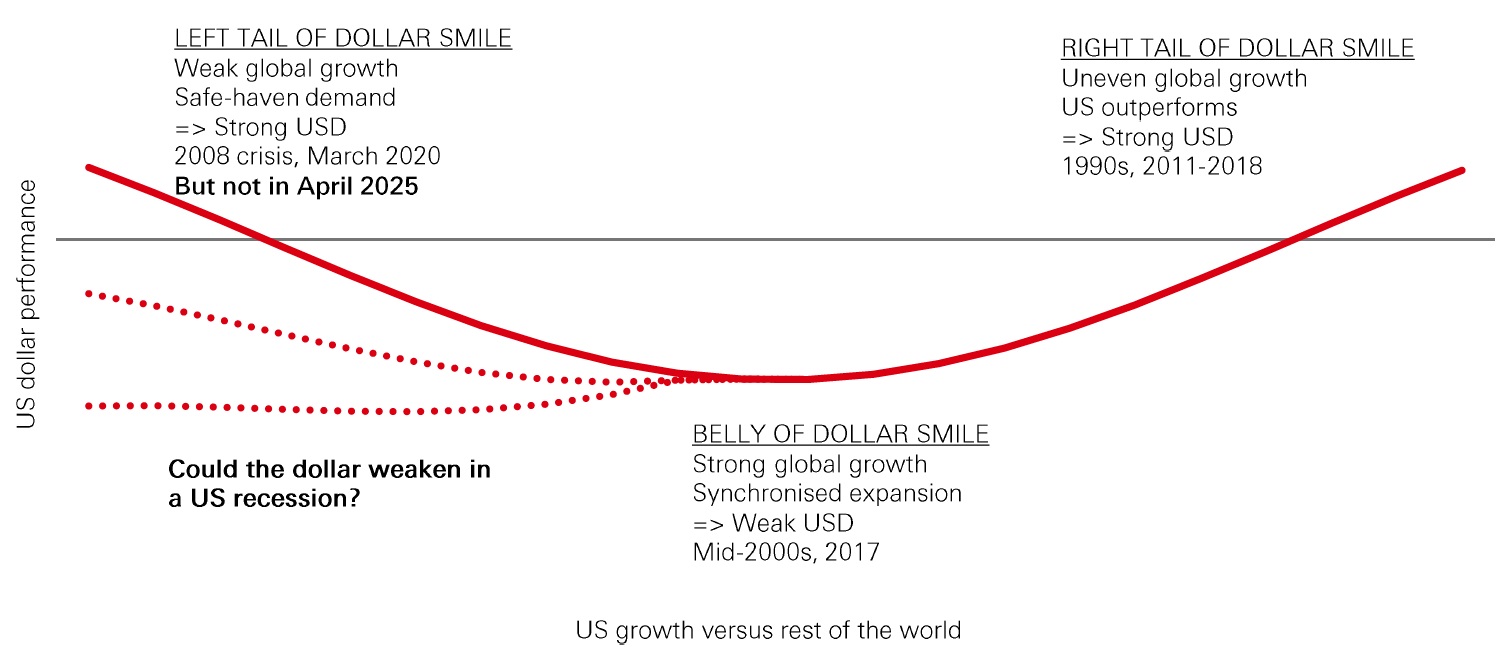
Figure 5 - The USD "smile"
Click the image to enlarge
Source: HSBC Asset Management, September 2025. For illustrative purposes only
At the same time, the USD weakened — again, the opposite to what would normally be expected under what is known as the "dollar smile" (Figure 5). The dollar smile is the notion that the USD strengthens both when:
- US growth significantly outperforms the rest of the world; and
- There is large negative growth shock or risk-off environment in markets
In contrast, the USD weakens when there is strong global growth as part of a synchronised expansion.
Events in April challenged this model with the left-side of the USD smile breaking down and potentially becoming more of a "smirk".
The USD typically strengthens on US outperformance or in risk-off episodes — the latter is now under question
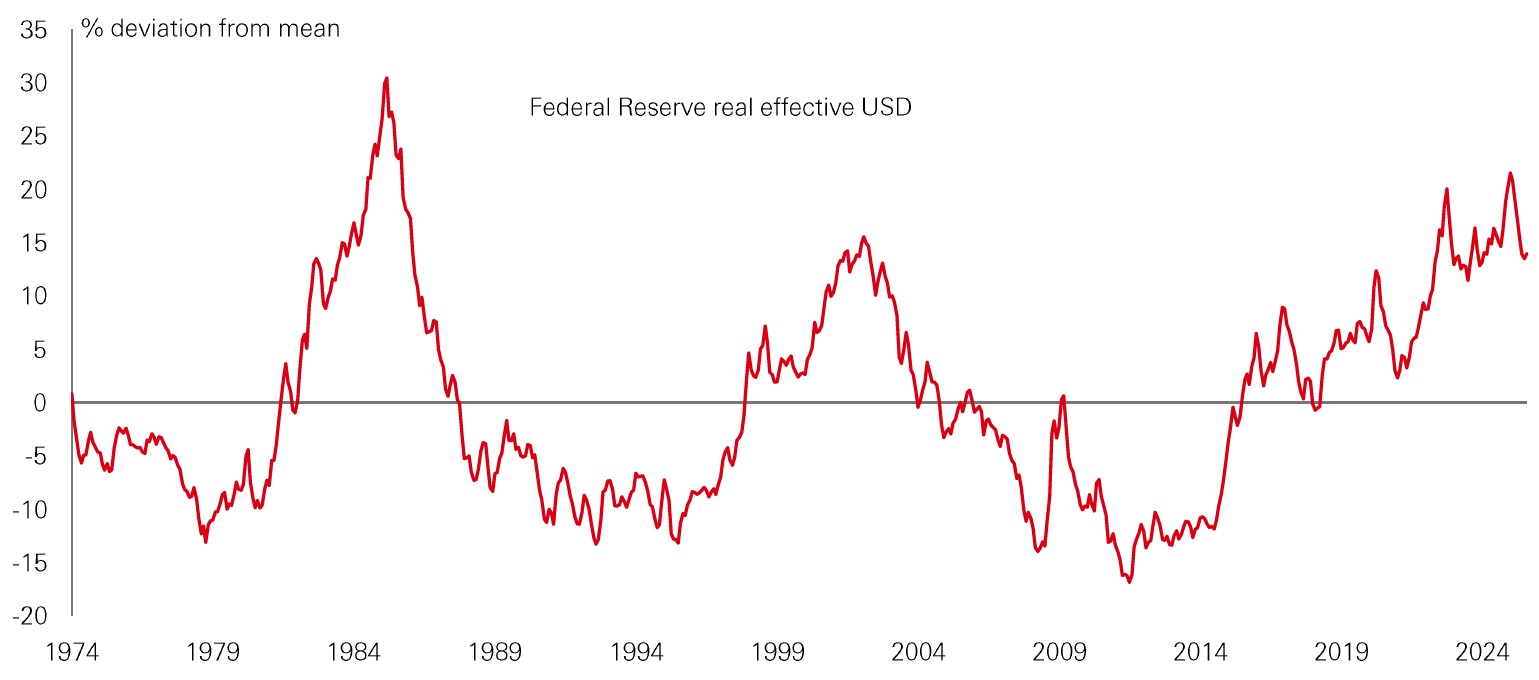
Figure 6 Real effective USD remains elevated
Click the image to enlarge
Source: HSBC Asset Management, US Federal Reserve, September 2025. The views expressed above were held at the time of preparation and are subject to change without notice. Any forecast, projection or target contained in this presentation is for information purposes only and is not guaranteed in any way. HSBC Asset Management accepts no liability for any failure to meet such forecasts, projections or targets.
While the USD has fallen since the start of the year, there remains significant downside potential on a multi-year horizon. The Federal Reserve's broad real effective USD index remains over 15 per cent above its long run average, the result of having been on a strengthening trend since 2011 (Figure 6). In turn, this trend correlates with sustained US growth and equity market outperformance seen over that time. But, as explained below, such outperformance is likely to be hard to repeat, removing some support for the USD.
The potential for a USD bear market over the coming years does not mean the USD's role as the world's main reserve currency is under imminent threat. Currently, there are limited alternatives, meaning that any move away from the USD as a reserve asset is likely to be gradual.
Difficult to maintain exceptional equity outperformance
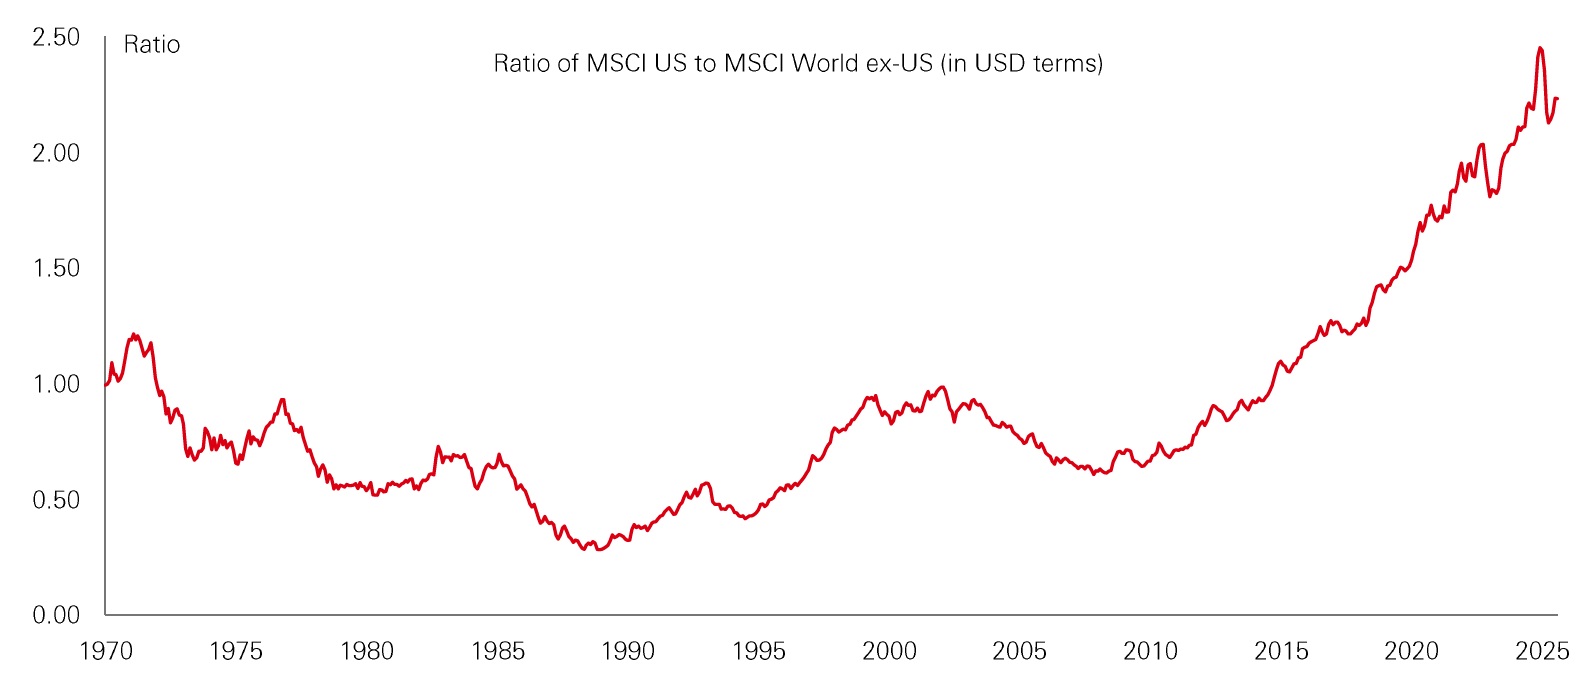
A key facet of US exceptionalism has been the outperformance of US growth and, even more so, US equities since the trough following the GFC (Figure 7).
Figure 7 - US equity performance vs other developed markets
Click the image to enlarge
Source: HSBC Asset Management, Macrobond, September 2025. The views expressed above were held at the time of preparation and are subject to change without notice. Any forecast, projection or target contained in this presentation is for information purposes only and is not guaranteed in any way. HSBC Asset Management accepts no liability for any failure to meet such forecasts, projections or targets.
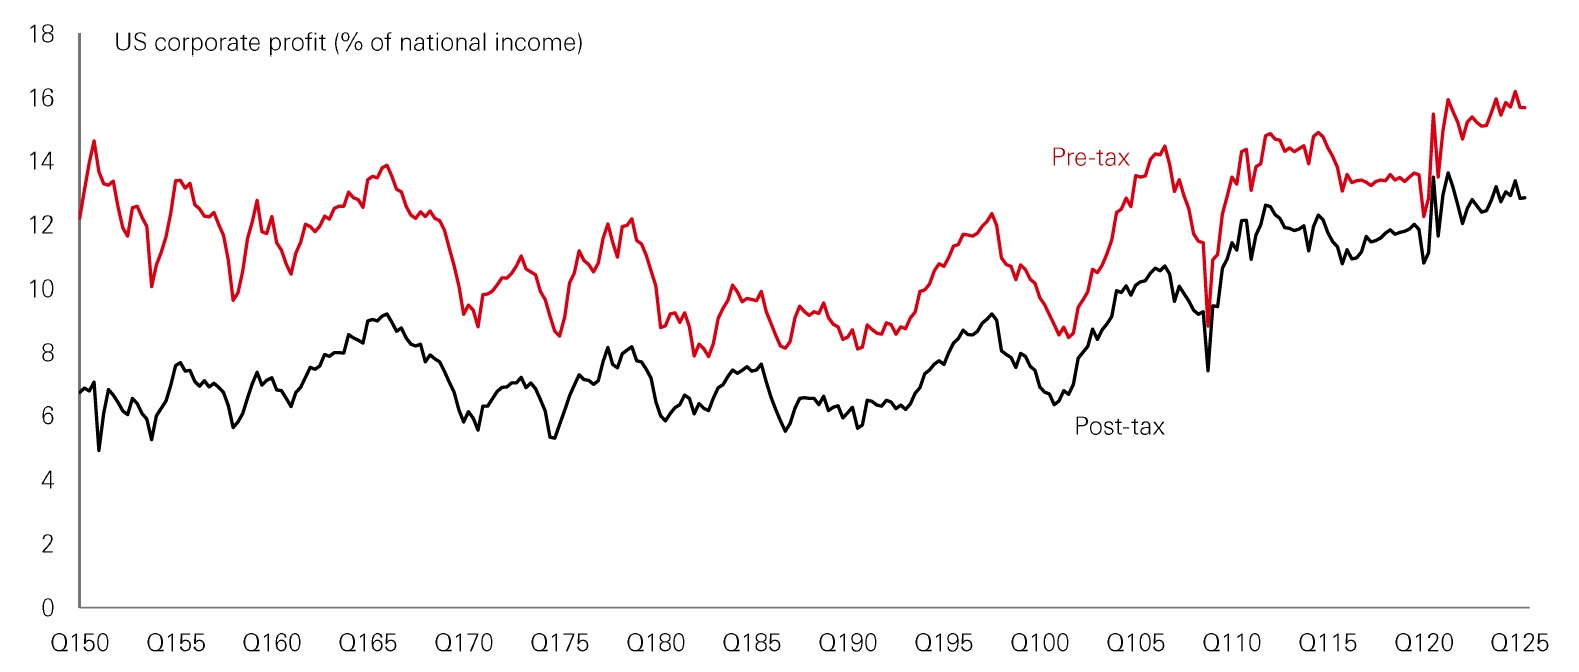
The outsized US stock market gains over the past 15 years have been underpinned by exceptional profit growth, which has taken the profit share in national income to record highs - especially on a post-tax basis (Figure 8). In fact, the profit share arguably began its ascent two decades earlier at the start of the 1990s, which corresponds with the onset of globalisation. Now, however, US trade policy has changed course and is imposing additional costs on international trade, which creates a headwind to profitability. This can happen directly, as firms absorb part of the US import tariffs and indirectly via the cost of restructuring supply chains.
A further supportive factor for US profits since the early 2000s has been the trend widening of the US fiscal deficit. In the national accounts, a wider government deficit boosts the pre-tax profit share — this is known as the Kalecki equation or identity. As set out above, the trend widening in the federal deficit is unlikely to correct anytime soon. But already-stretched public finances are likely to limit the federal government's ability to deliver large scale support to the economy and, therefore, profits in the face of future negative shocks.
More recently, data on the S&P 500 show corporate earnings have been driven by the Technology and Communication Services sectors. In 2024, they accounted for over 60 per cent of S&P 500 profit growth and are forecast to do the same again in 2025. Such concentration could present a risk if earnings in these sectors disappoint over the coming years. However, if Artificial Intelligence delivers the gains that some proponents claim, US leadership in this area could support potentially strong GDP growth and further productivity and profit outperformance.
A continued rise in the profit share from already-elevated levels could create wider economic and political issues if it comes at the expense of a further decline in the labour share of national income. But if Al boosts the potential growth of the economy and maintains the profit share, rather than increases it, US corporate earnings could continue to outperform those in other regions.
Stretched public finances are likely to limit the federal government's ability to deliver large scale support to the economy and, therefore, profits in the face of future negative shocks
Figure 8 - US corporate profit share
Click the image to enlarge
Source: HSBC Asset Management, Macrobond, September 2025. The views expressed above were held at the time of preparation and are subject to change without notice. Any forecast, projection or target contained in this presentation is for information purposes only and is not guaranteed in any way. HSBC Asset Management accepts no liability for any failure to meet such forecasts, projections or targets.
The rise in the profit share to a record high has been accompanied by expanding equity multiples. Low long-term interest rates in the post-GFC world facilitated a strong equity market by reducing the discount rate applied to future dividends or earnings. Indeed, one aim of the quantitative easing policies used in the aftermath of the GFC and Covid pandemic was to push investors into riskier assets.
Now, however, we have returned to a more "normal" monetary policy environment. In addition, US fiscal risks are likely to put upward pressure on UST yields over the coming years at a time when dividend and earnings yields are compressed. Overall, this suggests that although US equities can still deliver reasonable returns for long-term investors, replicating the exceptional US stock market outperformance of the last 15 years may prove difficult unless Al delivers strong productivity gains. Investors should therefore consider opportunities in other markets with good growth prospects and more reasonable valuations, such as emerging and frontier markets.
It may prove difficult to replicate the exceptional US equity performance of the last 15 years unless Artificial Intelligence delivers on its productivity and profitability promises
Where are the diversifiers in the world of fiscal dominance?
A world of fiscal dominance, supply shocks, de-globalisation, and high inflation has important implications for investors. Bond yields and risk premia are likely to be higher for longer with yield curves steeper, implying higher long-term expected returns, but also higher risk for government bonds. Spillover effects mean higher volatility and a shift in correlations. One consequence of all this is that traditional models of diversification become less reliable. Investors will need alternative ideas and alternative assets to achieve their investment objectives.
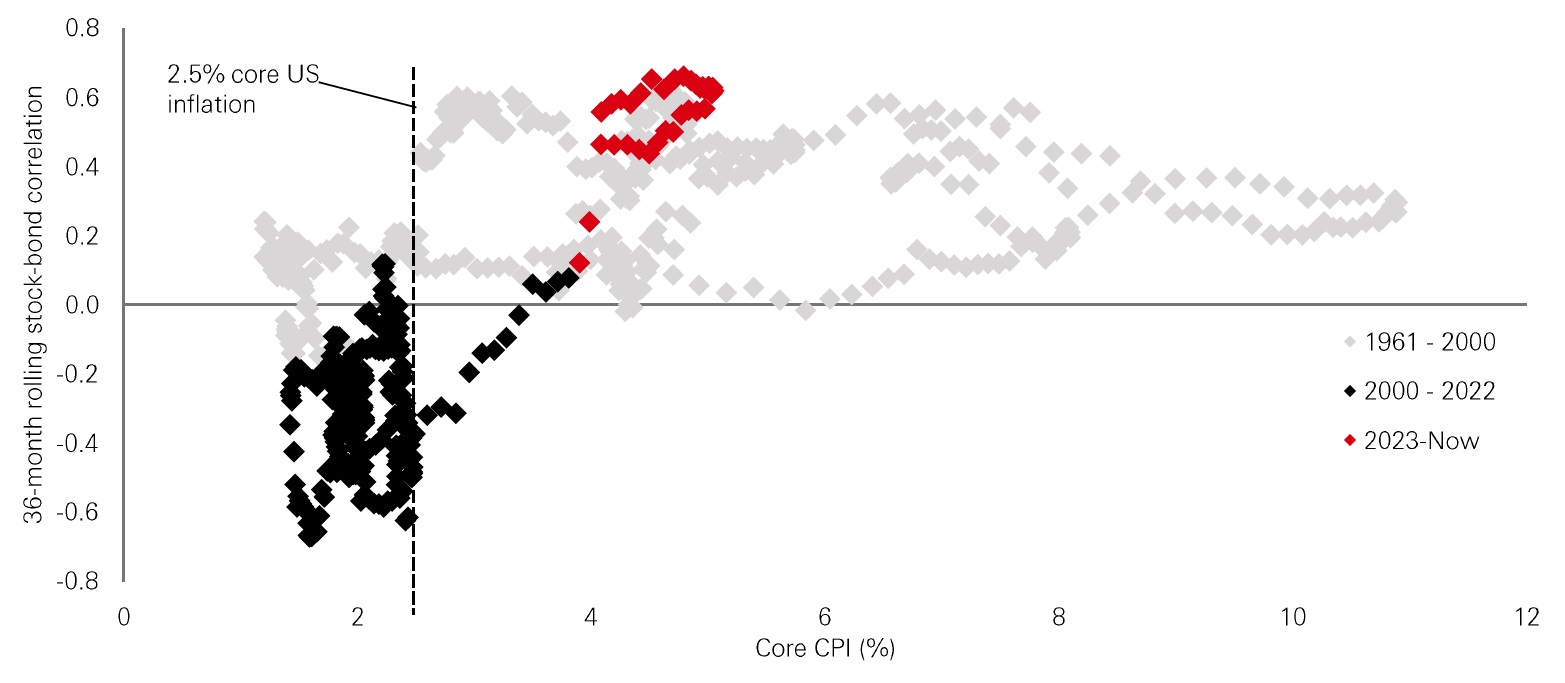
A persistently high-inflation regime is the chief risk to the received wisdom that government bonds hedge downside in risk assets. Figure 9 shows that the 2.5 per cent rate of inflation is a key inflection point — the correlation between stock and bond returns is typically negative below this level, but positive above. In recent years, we have been above that threshold with predictable consequences for the safe-haven characteristics of government bonds.
Stock-bond correlations are typically positive when inflation is high
Figure 9 - High inflation => loss of diversification
Click the image to enlarge
Source: HSBC Asset Management, Bloomberg, GFD, September 2025. The views expressed above were held at the time of preparation and are subject to change without notice. Any forecast, projection or target contained in this presentation is for information purposes only and is not guaranteed in any way. HSBC Asset Management accepts no liability for any failure to meet such forecasts, projections or targets. This information should not be construed as a recommendation to invest in the specific country, product, strategy or sector.
Investors seeking hedging and diversification have two choices— consider alternatives within traditional fixed income, or go to alternatives assets. We see a place for both approaches.
Traditional fixed income - shifting sands
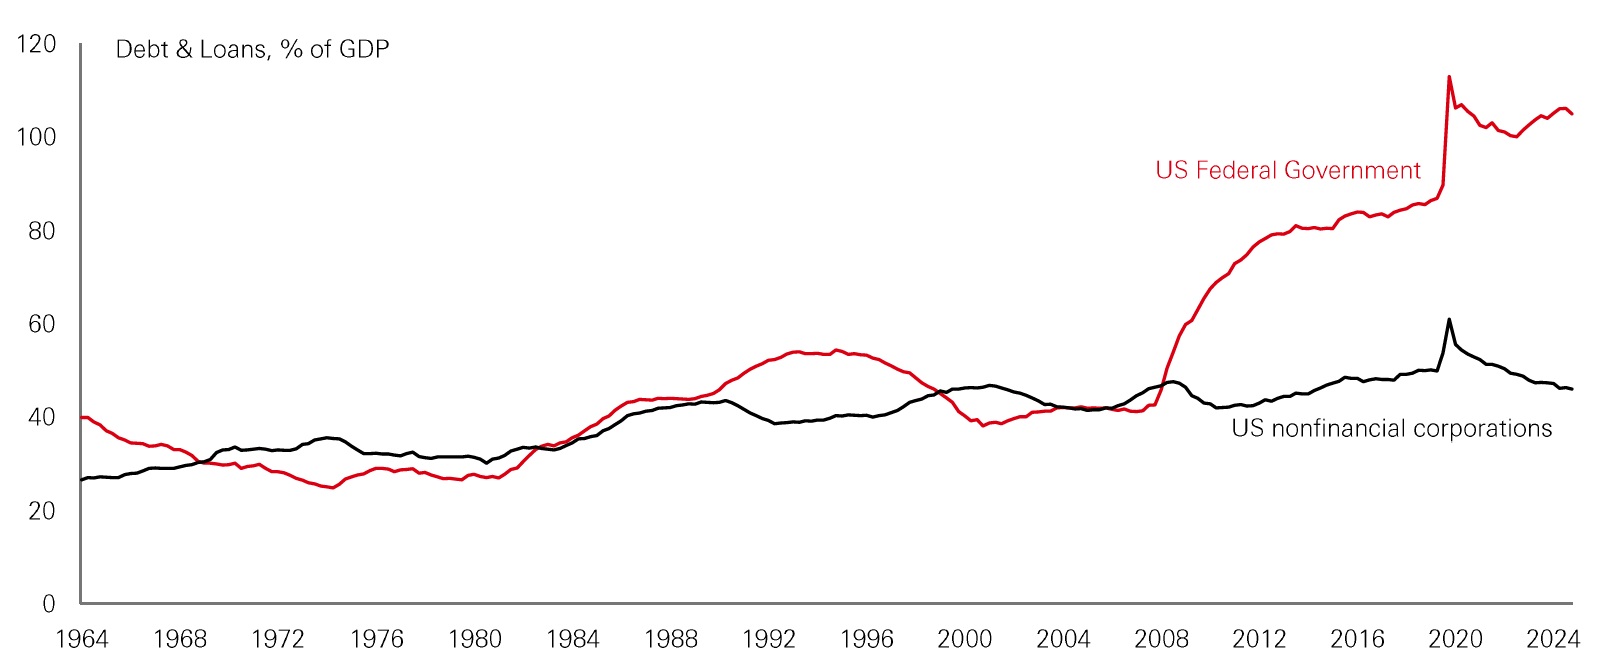
The familiar order in traditional fixed income has been disrupted. Fiscal premia for government bonds, especially in the US, are rising as government debt burdens balloon. Meanwhile, credit premia are shrinking as high-grade issuers have been deleveraging, lengthening debt maturities and building cash buffers. Figure 10 captures this remarkable divergence — US federal debt-to-GDP is at all-time highs and rising but corporate debt-to-GDP is below historical highs and falling. Credit spreads can remain low despite higher government bond yields because fundamentals justify a bigger increase in sovereign risk premia than credit risk premia. Our expected-return models support this theory — compared to the low-yielding pre-2022 years, the increase in the US credit risk premium is 40bp compared to an 80bp increase in the US Treasury risk premium. Investors are seeking safety in the fortress balances sheets of the high-grade corporate sector.
The conventional pecking order of riskiness is being upended in global fixed income
Figure 10 - US government vs corporates - structurally divergent balance sheets
Click the image to enlarge
Source: HSBC Asset Management, Macrobond, September 2025. The views expressed above were held at the time of preparation and are subject to change without notice. This information should not be construed as a recommendation to invest in the specific country, product, strategy or sector.
Investors may also be drawn to other sovereign bonds, reducing their reliance on US Treasuries, and gathering some diversification in today's "mutlipolar world". Swiss government bonds have proved popular, of course (see data table in Appendix). A future option could be European Safe Bonds (ESBies). These EU-wide safe assets could be introduced in the context of Germany's new 'military Keynesiansim' and would benefit from the balance-sheet strength of the stronger northern-European issuers through cross-European risk-pooling.
Similarly, emerging-market sovereigns also have much improved balance sheets, and EM Fl could well be part of the solution for investors, as we discuss in the next section.
Alternatives in a "traditional+" approach
The structural headwinds from higher-for-longer inflation and interest rates mean that traditional assets alone are unlikely to offer satisfactory solutions for investors. Alternatives are an important part of the answer.
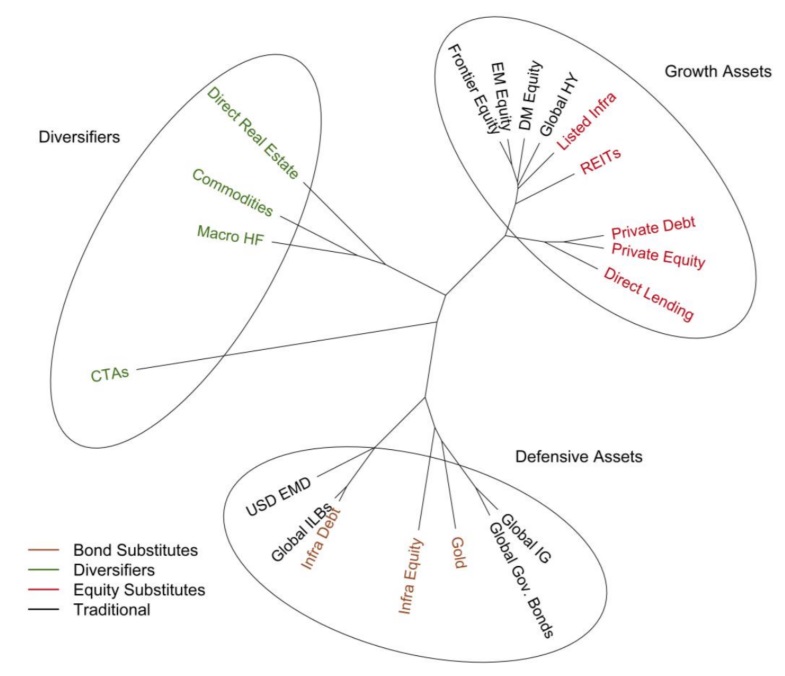
For strategic investors, alternatives can be usefully conceptualised in a "traditional+" framework, as represented in Figure 11, as equity substitutes, bond substitutes and diversifiers. Figure 11 displays an "unrooted tree" where the length of each "branch" represents how far two assets are from each other based on their statistical difference, derived from correlations - the closer two asset classes are in this diagram the more similar they are to each other in correlation structure.
Growth assets such as equities and equity-substitute alternatives deliver long-term performance. In our hierarchical clustering, alternatives like private equity/debt and direct lending perform the same role and increasingly will have an important role to play given the rich valuations on equities and high-yield debt.
Defensive assets aim to deliver capital preservation and volatility dampening, typically fulfilled with high-grade bonds. But the challenges from temperamental stock-bond correlations bring into focus the bond-substitute alternatives, like infrastructure debt and equity.
Lastly, we have Diversifiers, which provide stability when markets dislocate and have low correlations with the typical risk factor exposures of equities and fixed income.
Alternatives likely to prove indispensable for effective diversification in a traditional+ allocation framework
The value of investments and any income from them can go down as well as up and investors may not get back the amount originally invested. The views expressed above were held at the time of preparation and are subject to change without notice. This information should not be construed as a recommendation to invest in the specific country, product, strategy or sector. Diversification does not ensure a profit or protect against loss.
Figure 11 - A hierarchical clustering of asset classes
Click the image to enlarge
Source: HSBC Asset Management, Bloomberg, Pitchbook, Cliffwater, Scientific Infra & Private Assets, September 2025
Public-market liquid alternatives
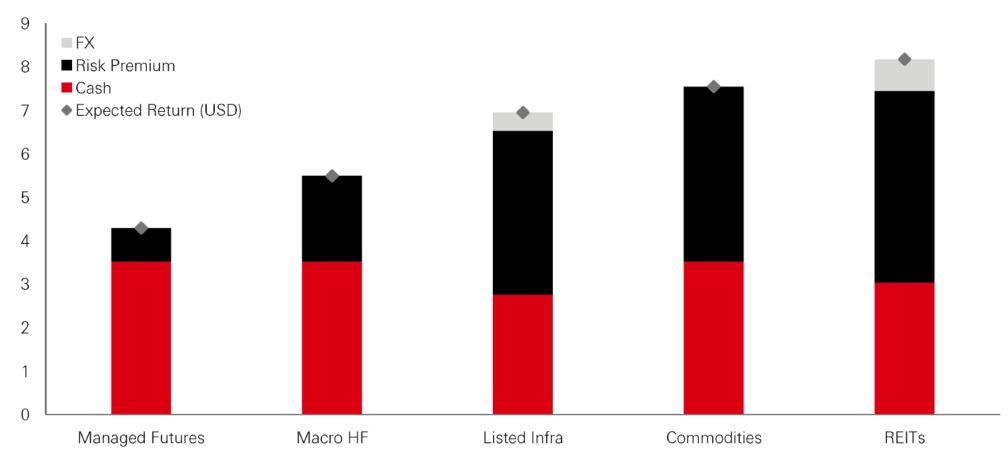
Liquid alternatives like hedge funds and systematic strategies offer significant strategic allocation benefits. Amid weakening long-term macro anchors such as stable growth and inflation and conservative fiscal policy, market volatility is set to remain high. Many hedge-fund strategies thrive on market uncertainty.
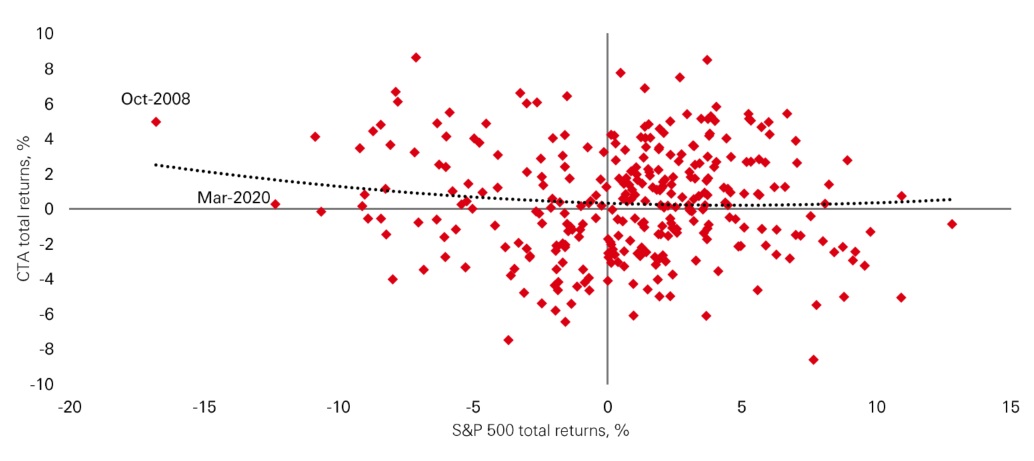
Equity market-neutral strategies perform well in volatile times when dispersion of stock returns is wide. Global-macro strategies benefit from taking long and short positions across asset classes based on interest rate movements and opportunities in commodity markets. Managed futures (CTAs) are another valuable component of a diversified hedge fund portfolio. CTAs typically exhibit low long-term correlation with risk assets and can offer return convexity, i.e. profits in both bullish and bearish market conditions (Figure 12).
The value of investments and any income from them can go down as well as up and investors may not get back the amount originally invested. The views expressed above were held at the time of preparation and are subject to change without notice. This information should not be construed as a recommendation to invest in the specific country, product, strategy or sector.
Figure 12 - CTAs offer a convex return profile
Click the image to enlarge
Source: HSBC Asset Management, Bloomberg, September 2025
According to our model estimates, the expected-return boost from liquid alternatives is sizeable as Figure 12 shows.
Figure 13 - Liquid alternatives ER decomposition, per cent
Click the image to enlarge
Source: HSBC Asset Management, September 2025.
The value of investments and any income from them can go down as well as up and investors may not get back the amount originally invested. The views expressed above were held at the time of preparation and are subject to change without notice. This information should not be construed as a recommendation to invest in the specific country, product, strategy or sector.
Private-market illiquid alternatives
Beyond the universe of public markets and alternatives, an optimal portfolio will likely feature a sizeable allocation to private markets. Like their public-market counterparts, private assets generate cash-flows with high expected returns and offer inflation protection (Figure 14). But their periodic valuation (typically quarterly) means much lower return volatility and materially higher Sharpe ratios than public assets. This also makes them an effective portfolio volatility dampener for loss-averse investors.
Figure 14 - Private markets ER decomposition, per cent
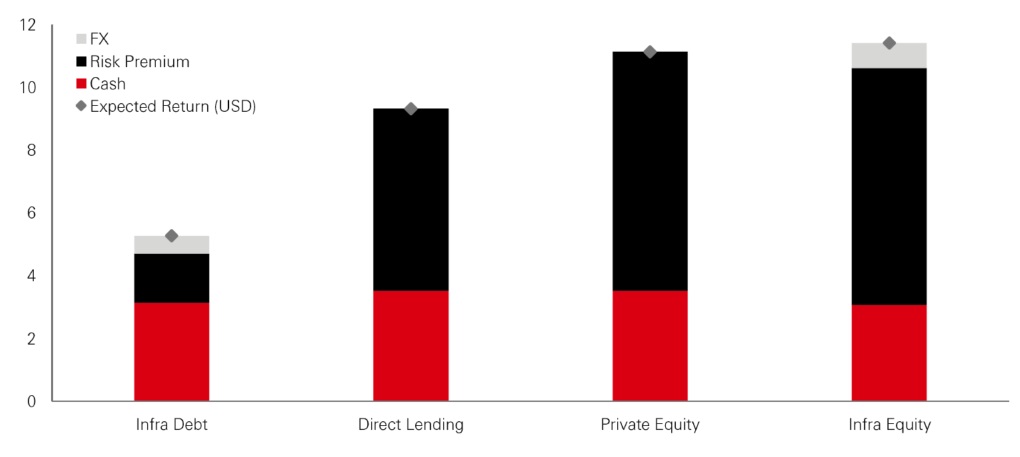
Click the image to enlarge
Source: HSBC Asset Management, September 2025
The benefits of private credit as a volatility dampener become evident once we consider the major drawdown episodes in credit assets. Direct lending experienced much smaller drawdowns during both the 2008 and 2020 Covid sell-offs and delivered a positive return during the 2022 inflation shock when most risk assets sold off following a sharp back-up in bond yields.
Figure 15 - Drawdowns on private versus public credit
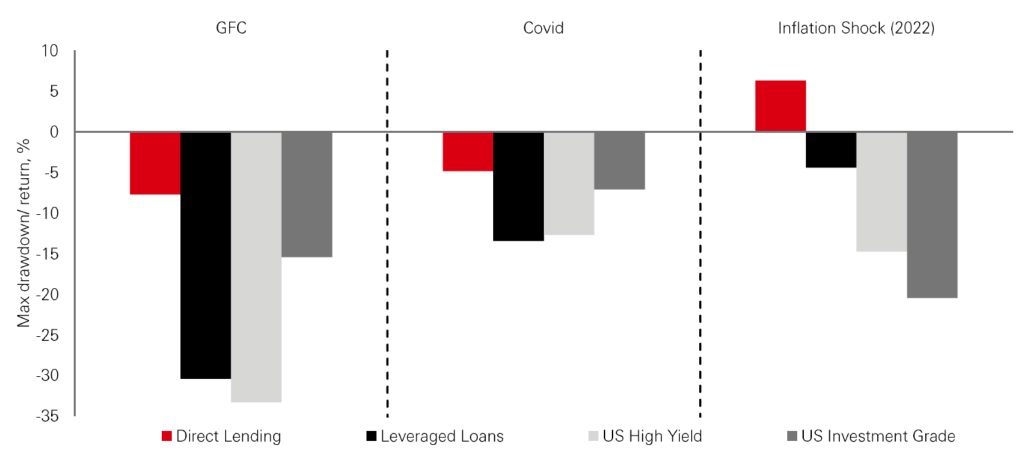
Click the image to enlarge
Source: HSBC Asset Management, Bloomberg, Cliffwater, September 2025
Private credit markets in Asia offer particularly compelling returns and a further opportunity to diversify away from US and European markets. Growth in the Asian market is likely to be fuelled by major investments in regional infrastructure such as smart cities and renewable energy, and increased intra-Asian investment amid US isolationism. Identifying such regional opportunities will likely be crucial in a multi-polar world where idiosyncratic drivers will be more decisive for performance.
In the Real world
Alternatives offer avenues for both high returns and portfolio defensiveness
Finally, the world of real assets provides yet another avenue for effective diversification as a defensive and low-volatility portfolio building-block. Against a backdrop of cooler growth and monetary easing, real estate's defensive attributes can offer investors a source of portfolio resilience. Listed infrastructure — publicly traded companies that own and/or operate essential infrastructure — can act as an effective long duration play generating dependable cashflows and high dividend yields (currently well above global equities).
Some of the strongest returns across the asset class have come from the mid-market (Figure 16), where infrastructure projects tend to be smaller but less prone to cost over-runs and delays. After a period of strong performance from US infrastructure-related sectors, our infrastructure team believes valuations are now more attractive in Europe, the UK, and China on a relative basis.
The global rollout of data centres is a key growth area, as it drives huge demand for power generation, requiring investment in key areas like electrification, transmission, and distribution grids. These developments are occurring in an environment where infrastructure investment is being boosted by structural trends including active policy measures and the digital and energy transitions. Asia stands out as a major demand centre that can offer attractive opportunities to strategic investors.
The value of investments and any income from them can go down as well as up and investors may not get back the amount originally invested. The views expressed above were held at the time of preparation and are subject to change without notice. This information should not be construed as a recommendation to invest in the specific country, product, strategy or does not ensure a profit or protect against loss.
Figure 16 - Global unlisted infrastructure
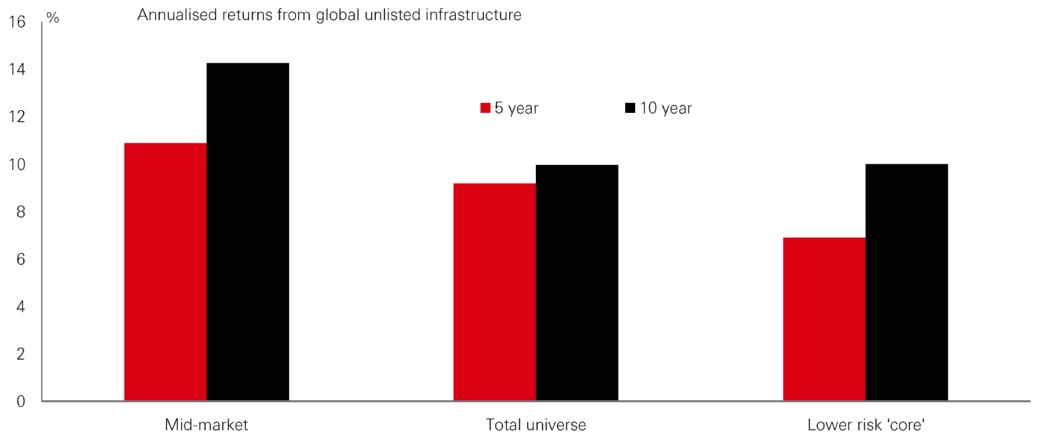
Click the image to enlarge
Source: HSBC Asset Management, September 2025
Are we on the edge of an EM bull market?
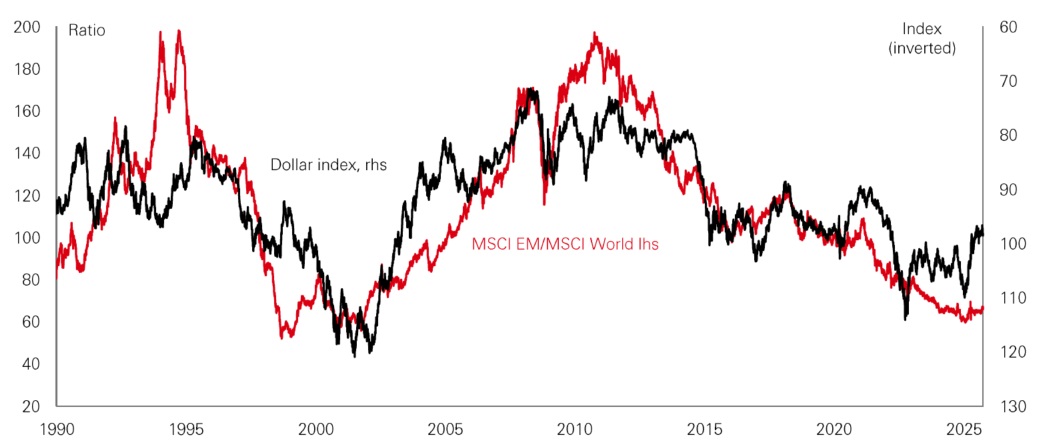
Emerging markets (EM) are probably entering a structural opportunity phase, underpinned by the early stages of a long-term US dollar bear market. Given that historical dollar cycles have averaged five to seven years, the global tailwinds for EM may just be beginning. Risks of a dollar-bearish cycle stem from stretched valuations, large US twin deficits, and a potential diversification away from dollar assets. This would be particularly favourable for EM assets through easier financial conditions and increased foreign investment flows. Figure 17 shows clearly the structural relationship between relative EM-equity performance and the dollar. If the dollar bear market is sustained, so will be EM outperformance.
A structural opportunity phase is likely opening up for emerging markets
Figure 17 - Dollar and EM equity relative performance
Click the image to enlarge
Source: HSBC Asset Management, Bloomberg, Macrobond, September 2025
There are also deeper structural forces amplifying the case for EM. US exceptionalism is waning amid fiscal unsustainability and political dysfunction and the old global order is fracturing with the centre of economic gravity shifting towards Asia and the Global South. Rather than be a beta play on global growth and dollar liquidity, EM is likely to be central in this new multipolar reordering, which presents global investors with a generational choice to allocate to EM assets.
The views expressed above were held at the time of preparation and are subject to change without notice. Any forecast, projection or target where provided is indicative only and not guaranteed in any way. This information should not be construed as a recommendation to invest in the specific country, product, strategy or sector.
Premium growth rates
No longer a homogenous group, EMs now offer a broad, differentiated investment opportunity set. The typical export-oriented growth models of the 1990s have paved the way for a wide range of growth paradigms, ranging from domestic-demand and import-substitution driven growth narratives to high-tech digitisation driven manufacturing stories. EMs provide premium rates of trend growth in a world where many developed markets face weakening trend growth and high debt levels.
Trend growth is expected to average 5-7 per cent for domestic-demand driven Asian giants like India and Indonesia. Whilst continuing to be a globally competitive service-sector hub, India is also emerging as a manufacturing base with a strong focus on self-sustainability. And as China matures as a global manufacturing hub, the likes of Vietnam are stepping in with the promise of high long-term returns on investment.
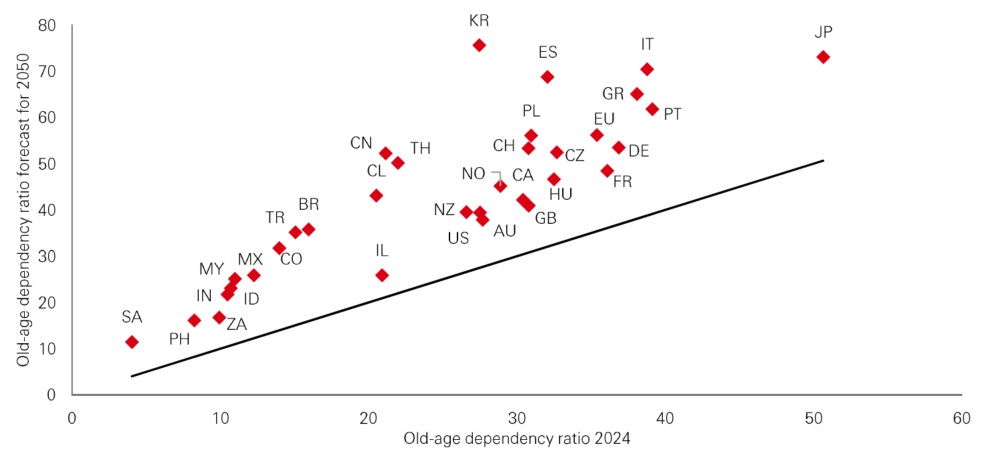
These premium rates of growth are underpinned by favourable demographics. By 2050, all advanced economies are projected to have extremely elevated old-age dependency ratios. Many EMs look much better in comparison (Figure 18). Young, growing populations, rising consumption, expanding labour forces, and digitisation all support higher EM trend growth versus ageing advanced economies.
The world's premium rates of growth will be found in EM
Figure 18 - Populations ageing everywhere but less so in many EMs
Click the image to enlarge
Source: HSBC Asset Management, World Bank, Macrobond, September 2025
ISO Alpha-2 country code —Australia (AU), Brazil (BR), Canada (CA), Chile (CL), China (CA), Colombia (CO), Czechia (CZ), Euro Area (EU), France (FR), Germany (DE), Greece (GR), Hungary (HU), India (IN), Indonesia (ID), Israel (IL), Italy (IT), Japan (JP), Malaysia (MY), Mexico (MX), Norway (NO), New Zealand (NZ), Philippines (PH), Poland (PL), Saudi Arabia (SA), South Africa (ZA), South Korea (KR), Spain (ES), Switzerland (CH), Thailand (TH), Turkey (TR), United Kingdom (GB), United States (US)
The views expressed above were held at the time of preparation and are subject to change without notice. Any forecast, projection or target where provided is indicative only and not guaranteed in any way. This information should not be construed as a recommendation to invest in the specific country, product, strategy or sector.
Fewer fragilities
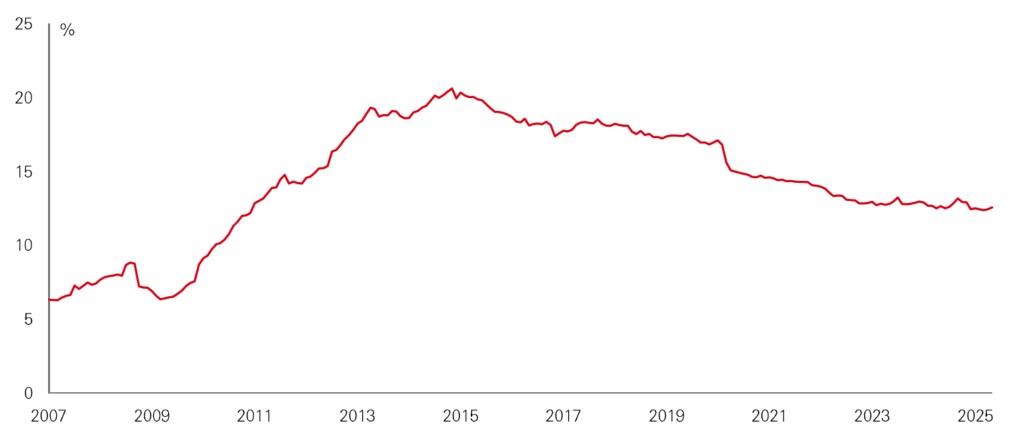
One stereotypical EM fragility has been that of foreign capital flight. However, domestic investors are increasingly becoming dominant in EM local markets and the share of foreign investors has been in trend decline (Figure 19). A continuation of this trend could help EM decouple from global liquidity cycles. Both EM monetary policy and foreign capital flows would increasingly reflect domestic fundamentals rather than global sentiment. More robust local investor bases would help stabilise valuations during external shocks and loosen constraints on EM authorities to pursue optimal policy.
EM is fundamentally much stronger than a decade ago
Figure 19 - Foreign share of EM local-currency bond markets (ex-China)
Click the image to enlarge
Source: HSBC Asset Management, J.P. Morgan, September 2025.. The views expressed above were held at the time of preparation and are subject to change without notice. Any forecast, projection or target where provided is indicative only and not guaranteed in any way. This information should not be construed as a recommendation to invest in the specific country, product, strategy or sector.
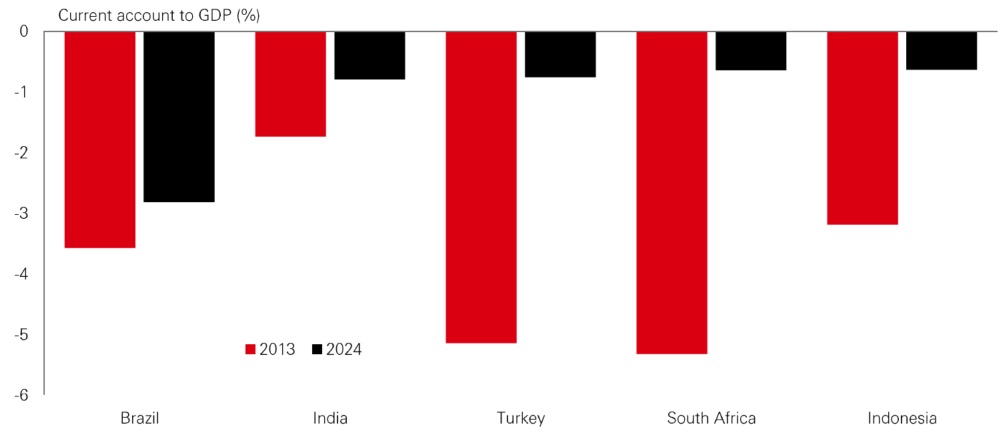
At the same time, there have been clear and substantive fundamental improvements too. A good case in point is the erstwhile "fragile five" economies—India, Indonesia, South Africa, Brazil, and Turkey. In contrast with 2013, when large current account deficits and weak policy frameworks defined fragility, these economies now exhibit high real yields, competitively valued exchange rates and sound external balances (Figure 20).
Figure 20 - No more fragile - current account balances in 2013 versus 2024
Click the image to enlarge
Source: HSBC Asset Management, IMF WEO, Macrobond, September 2025
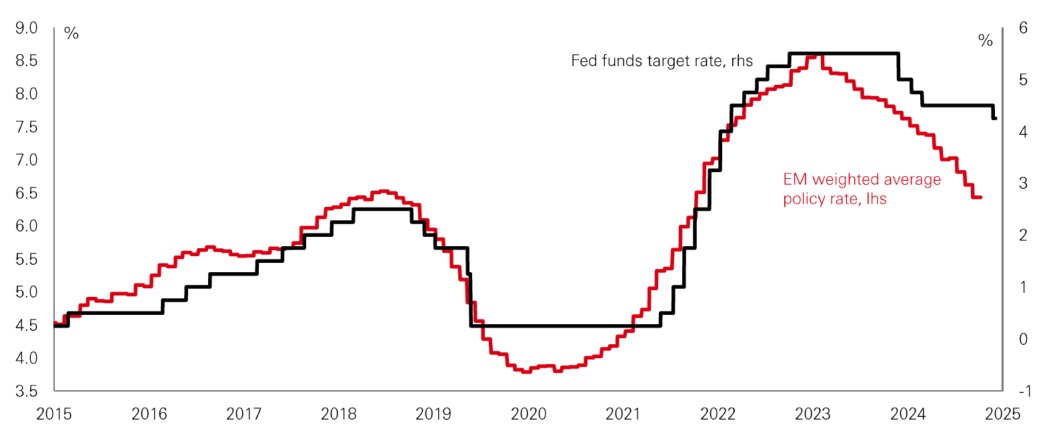
Across these markets, orthodox policy frameworks have taken hold: inflation targeting regimes, credible independent central banks and fiscal prudence are becoming standard features. Notably, many EMs raised interest rates proactively as early as 2021 —well before the US Federal Reserve—allowing them to cut rates in advance of the Fed (Figure 21). And in recent months, while the Fed was on a hawkish hold, a number of EMs, including India, Mexico, Indonesia, Poland, South Africa, and Egypt, were able to ease policy with confidence.
EM policy is increasingly less dependent on Fed policy
Figure 21 - EM monetary policy and Fed funds rate
Click the image to enlarge
Source: HSBC Asset Management, Federal reserve bank of Dallas, Macrobond, September 2025
The views expressed above were held at the time of preparation and are subject to change without notice. This information should not be construed as a recommendation to invest in the specific country, product, strategy or sector.
South Africa is a good example of how a previously weak EM has embraced orthodox policy. The government is embarking on public-sector reforms while the central bank is lowering its inflation target to lock in lower rates. The former poster child of EM twin-deficit risks has had a modest current account deficit and an improving fiscal balance.
Frontiers: Cheap, differentiated and uncorrelated
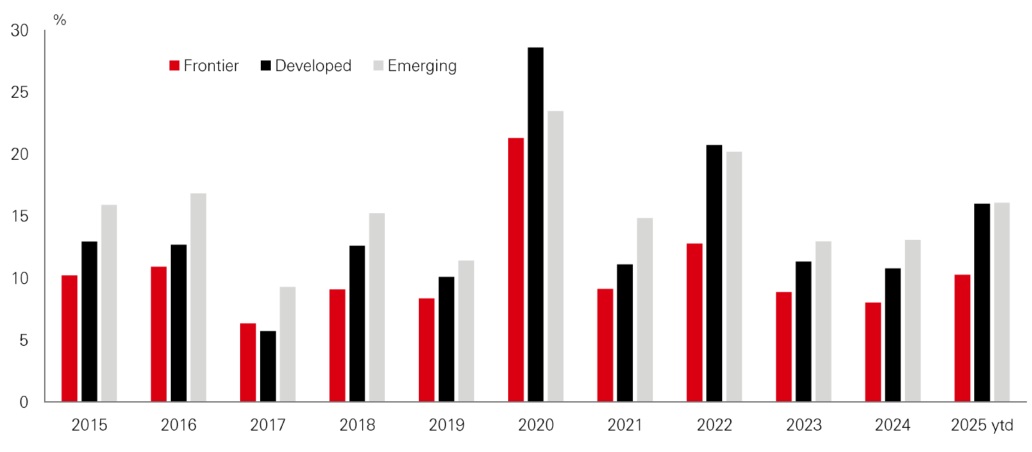
Beyond EM proper, frontier markets offer another dimension of opportunity. These smaller, less liquid economies are structurally cheap and consistently feature low correlations with major markets thanks to lower integration and more idiosyncratic risks. Strikingly, Figure 22 shows that frontier equities have consistently had lower volatility than both DM and mainstream EM equities.
Frontiers are structurally cheap and strong diversifiers
Figure 22 - Annual equity market volatilities
Click the image to enlarge
Source: HSBC Asset Management, Bloomberg, September 2025
Frontiers are the space where structural reform can be quite dramatic. Argentina stands out as a textbook case. After years of deficits, high inflation and capital controls, the new administration implemented "shock-therapy" reforms. Last year it delivered its first fiscal surplus since the 2000s after recording a near 7 per cent deficit in 2017. Monthly inflation collapsed from 25 per cent in December 2023 to under 3 per cent a year later. The recent turmoil shows that the long-term road to reform would be bumpy. Yet, the improvements achieved thus far are remarkable.
Vietnam is another notable example of structural change benefitting from a shift of manufacturing out of China. Imported technology and digitisation are significant boosts to trend growth in an environment of domestic liberalisation and other reforms.
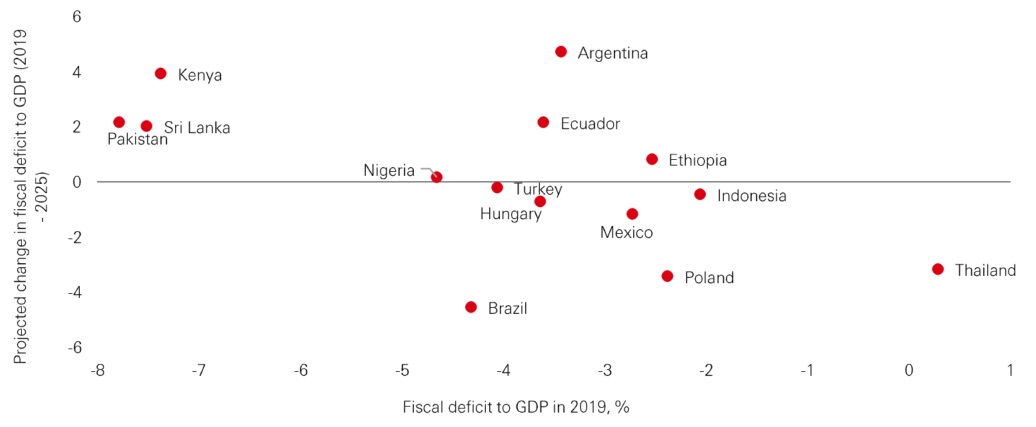
Others are quietly following suit, with strengthening external positions, fiscal reforms, and prudent policy frameworks. Notable examples are Kenya, Ethiopia, Ecuador, and Sri Lanka. Figure 23 shows how several frontier markets have experienced marked improvements in their fiscal trajectories, even as some of the mainstream EMs have slipped slightly.
The views expressed above were held at the time of preparation and are subject to change without notice. This information should not be construed as a recommendation to invest in the specific country, product, strategy or sector.
Figure 23 - Frontier markets with improving fiscal trajectories
Click the image to enlarge
Source: HSBC Asset Management, IMF Fiscal Monitor, Macrobond, September 2025
EM local-currency assets to be star performers
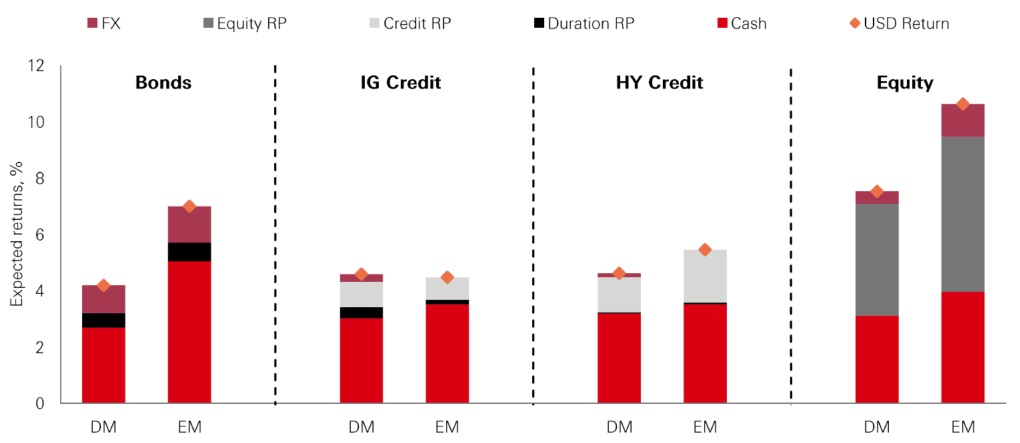
Our expected returns models identify large expected-return advantage for EM local-currency asset classes. Over a ten-year horizon, EM equities and local-currency bonds are expected to return 280bp and over 300bp in excess of their DM counterparts. As Figure 24 shows, EM valuations are boosted by many components in our modelling framework — a higher cash rate in a higher-for-longer world, larger equity risk premia when US exceptionalism may be peaking, and high currency expected returns when the dollar cycle may be turning.
EM offers higher expected returns across most asset classes
Figure 24 — EM local assets have the strongest expected returns
Click the image to enlarge
Source: HSBC Asset Management, RP stands for risk premium, September 2025.
Past performance does not predict future returns. The views expressed above were held at the time of preparation and are subject to change without notice. Any forecast, projection or target where provided is indicative only and not guaranteed in any way. This information should not be construed as a recommendation to invest in the specific country, product, strategy or sector.
For over a decade, EM has felt like a value trap to investors — valuations were cheap but kept getting cheaper. However, the structural environment is likely shifting with a dollar bear market and slowing growth in advanced economies amid deteriorating demographics.EM is the only investment universe underpinned by high rates of growth, positioning itself for long-term outperformance. Local currency assets are maturing with widening domestic investor bases, sound fundamentals, orthodox policy frameworks and healthier external balances. Meanwhile, frontiers are also beginning to attract investor attention for their structural potential.
Against this structural backdrop, EMs present a generational opportunity for investors. Local-currency assets — notably equities and bonds - stand out for their long-term excess-return potential.
The views expressed above were held at the time of preparation and are subject to change without notice. Any forecast, projection or target where provided is indicative only and not guaranteed in any way. This information should not be construed as a recommendation to invest in the specific country, product, strategy or sector.
10-year expected returns for selected assets
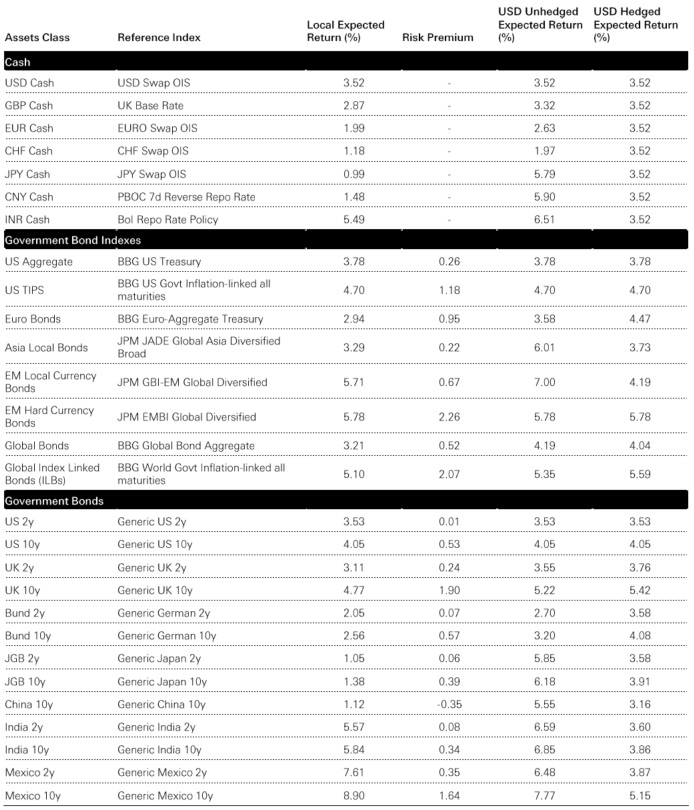
Click the image to enlarge
Source: HSBC Asset Management, September 2025
Any forecast, projection or target where provided is indicative only and is not guaranteed in any way. HSBC Asset Management accepts no liability for any failure to meet such forecast, projection or target. This information shouldn't be considered as a recommendation to buy or sell specific investments mentioned.
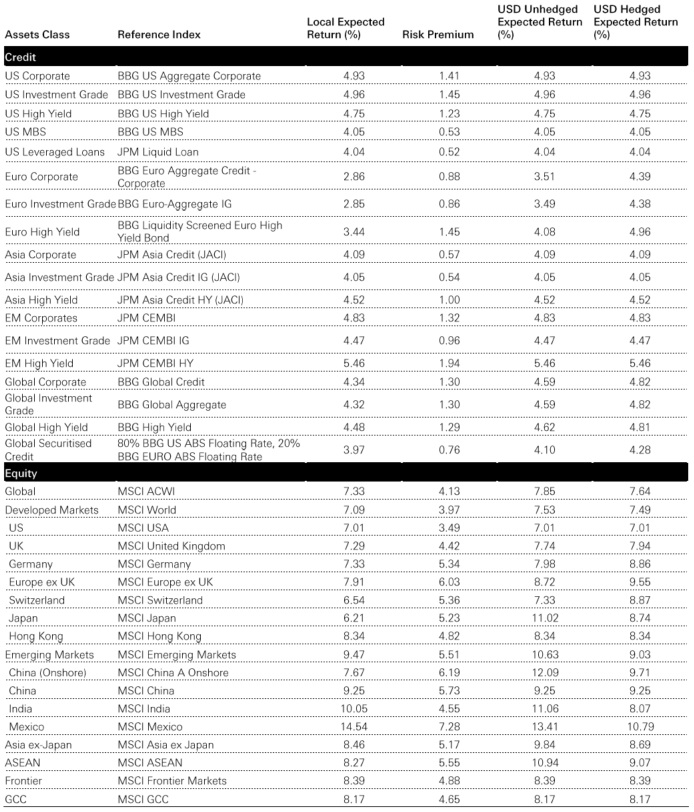
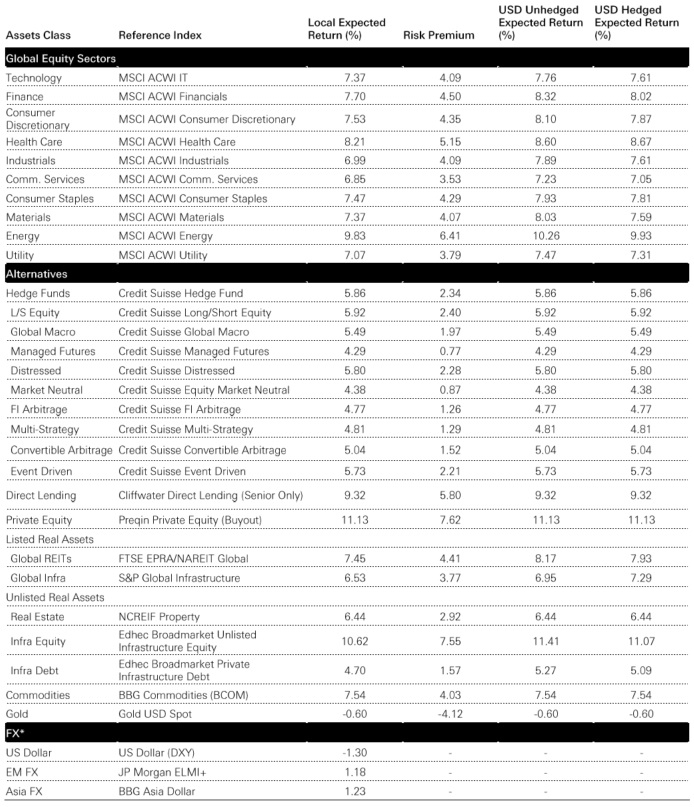
Click the image to enlarge
*Reported as price return, all others total return. Source: HSBC Asset Management, September 2025
Any forecast, projection or target where provided is indicative only and is not guaranteed in any way. HSBC Asset Management accepts no liability for any failure to meet such forecast, projection or target. This information shouldn't be considered as a recommendation to buy or sell specific investments and sectors mentioned.
Technical appendix
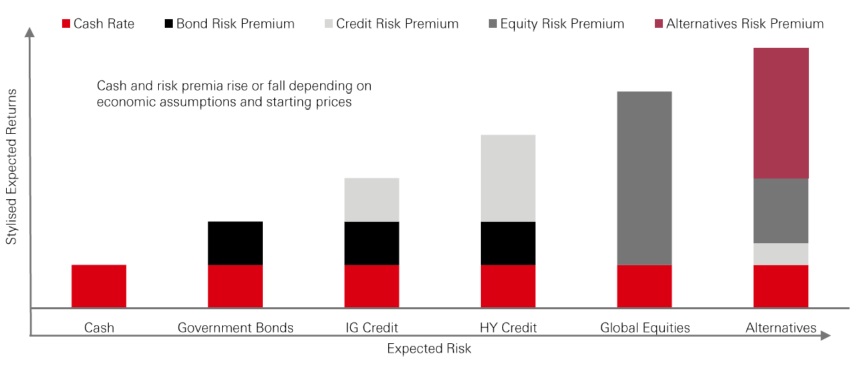
Asset class return assumptions come from two key "building blocks": (1) a risk-free interest rate; and (2), a risk premium, which reflects the future reward for taking economic, asset-specific, specialist, or currency risk.
Figure 25 illustrates this idea. The risk-free interest rate is modelled using our scenario for policy interest rates for advanced and emerging economies. Then, based on current market pricing and the economic assumptions for asset class fundamentals, we model a "risk premium" for each asset. By doing this, our expected returns framework is anchored by current market pricing, rather than just our economic forecasts.
Figure 25 - A risk premia approach to building expected returns
Click the image to enlarge
Source: HSBC Asset Management, September 2025
Under normal economic and market conditions, the more risk we take, the greater the return. But over the market cycle, the implied rewards (or risk premium) to each asset class can vary materially. This means that, in real time, the bars in Figure 19 will move up and down; sometimes risk will be over-rewarded, and at other times, under-rewarded.
This framework provides a disciplined way to assess the changing market odds across our investable universe. It can help asset allocators to tilt investment portfolios through time, in favour of more attractively-priced asset classes and away from less-attractive ones.
We currently estimate expected returns for 300+ asset classes, including developed and emerging economies, alternative assets, and currencies. Figure 20 explains some key details. Further information on our approach is available.
Note: For informational purposes only and should not be construed as a recommendation to invest in the specific country, product, strategy or sector. The views expressed above were held at the time of preparation and are subject to change without notice.
Figure 26 - Expected returns framework
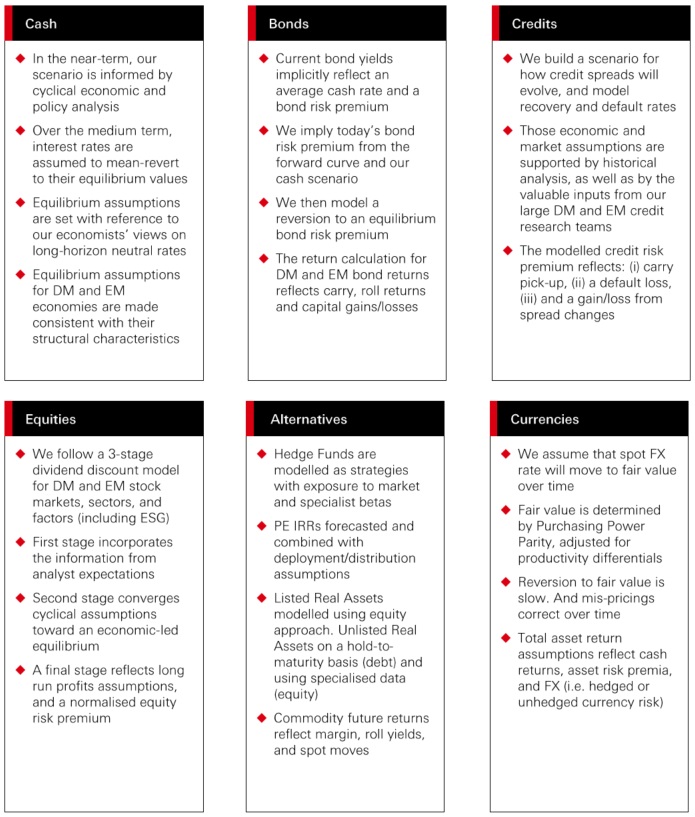
Click the image to enlarge
Note: The views expressed above were held at the time of preparation and are subject to change without notice. Any forecast, projection or target where provided is indicative only and not guaranteed in any way. HSBC Asset Management accepts no liability for any failure to meet such forecast, projection or target. This document provides a high level overview of the recent economic environment. It is for marketing purposes and does not constitute investment research, investment advice nor a recommendation to any reader of this content to buy or sell investments. It has not been prepared in accordance with legal requirements designed to promote the independence of investment research and is not subject to any prohibition on dealing ahead of its dissemination.
Note: For information purpose only and should not be constructed as a recommendation to invest in the specific country, product, strategy or sector. The views expressed above were held at the time of preparation and are subject to change without notice.
